GEOTECHNICALENGINEERING
BURLINGTON
HomeGeophysicsSeismic tomography (refraction/reflection)

Seismic Tomography (Refraction/Reflection) in Burlington, ON

Geotechnical engineering with regional judgment.

LEARN MORE

The 2020 National Building Code of Canada (NBCC), together with CSA A23.3, places clear emphasis on Site Class determination based on shear-wave velocity profiles, and in Burlington this becomes particularly relevant where the Queenston Shale transitions into limestone and dolostone of the Lockport Formation. The Halton till that blankets much of the Niagara Escarpment corridor masks the true bedrock surface, making borehole-only investigations incomplete. We run seismic tomography lines—both refraction and high-resolution reflection—to map the overburden-bedrock interface continuously, rather than inferring it from scattered point data. The 43.3°N latitude means we deal with a distinct freeze-thaw cycle that affects near-surface velocities seasonally, so we document ground conditions at time of acquisition for defensible interpretation. When the objective includes rippability assessment or mapping fracture zones within the upper bedrock, combining tomography with seismic refraction profiling gives us the P-wave velocity structure, while a MASW survey provides the complementary Vs profile needed for Site Class E or D evaluations under NBCC Table 4.1.8.4.A.

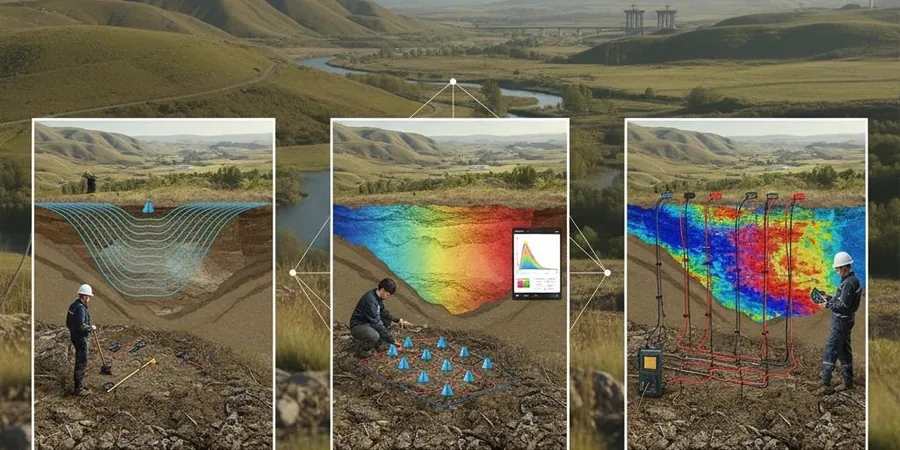
A continuous velocity cross-section from seismic tomography reveals the bedrock topography that scattered boreholes miss—critical in Burlington’s escarpment terrain.

Our service areas

Methodology and scope

The field setup we deploy across Burlington sites typically involves a 24- to 48-channel seismograph with 4.5 Hz geophones spaced between 2 and 5 metres, depending on target depth. For refraction tomography we use a sledgehammer-and-plate source on smaller lots and a weight-drop or accelerated weight-drop system when we need to reach depths beyond 25 metres—common in the Aldershot and Tyandaga areas where overburden can thicken significantly. The reflection component requires a higher-frequency source, often a buffalo gun or downhole sparker if groundwater is present, and we stack shots to improve signal-to-noise ratio against the background hum from the QEW and rail corridors that cut through the city. Processing runs through ray-tracing inversion for first-arrival tomography and CMP-based velocity analysis for the reflection data, with the final merged model delivered as a 2D velocity cross-section. In karst-prone zones near the escarpment edge, we have found that velocity anomalies below 800 m/s in the limestone often correspond to mud-filled cavities or widened joints, a pattern we flag early in the interpretation because it directly informs foundation depth decisions and the need for grouting programs during excavation.
Seismic Tomography (Refraction/Reflection) in Burlington, ON
Technical reference — Burlington

Local considerations

Burlington sits at the interface of two distinct physiographic zones: the flat lake plain sloping toward Hamilton Harbour and the fractured caprock of the Niagara Escarpment. This contrast creates a risk profile that standard desk studies often underestimate. On the escarpment side, we encounter stress-relief joints opened by glacial unloading, and seismic velocities can drop 30–40% within a few metres laterally, signalling unstable blocks that would go undetected by drilling alone. Near the harbour and along the lower stretches of Bronte and Grindstone creeks, the water table sits high year-round, and saturated silty-clay till attenuates high-frequency reflection energy, forcing us to adjust acquisition parameters on the fly to preserve resolution. The biggest operational risk is misidentifying a low-velocity shale layer as competent bedrock; weathered Queenston Shale can look stiff in a split-spoon sample but yields velocities under 1200 m/s, indicating it will degrade rapidly when exposed to air and moisture cycles during excavation.

Need a geotechnical assessment?

Reply within 24h.

Email: contact@geotechnicalengineering.co

Applicable standards

NBCC 2020 (Site Class determination), CSA A23.3 (Concrete design reference), ASTM D5777-18 (Seismic refraction for subsurface investigation), FHWA-NHI-05-037 (Geotechnical site characterization), ASTM D7400-19 (Downhole seismic testing, referenced for velocity calibration)

Technical parameters

ParameterTypical value
MethodSeismic refraction and reflection tomography (P-wave and S-wave)
Geophone array24 to 48 channels, 4.5 Hz vertical-component geophones (14 Hz for reflection)
Typical geophone spacing2 m (high-resolution) to 5 m (deep targets)
Energy sourceSledgehammer, weight-drop, or buffalo gun depending on depth and site access
Maximum investigation depth25–80 m depending on array length and source energy
Velocity range mapped300 m/s (loose fill) to >5000 m/s (competent dolostone)
Applicable standardsASTM D5777-18, NBCC 2020, CSA A23.3, FHWA-NHI-05-037
Final deliverables2D velocity tomogram, interpreted bedrock surface, rippability log, Site Class report

Frequently asked questions

How deep can seismic tomography see in Burlington’s glacial till and shale?

With a 48-channel array and a weight-drop source, we routinely image to 40–50 metres in the Halton till and Queenston Shale. Reflection mode can extend that to 70–80 metres when stratigraphic contrasts are strong, though resolution decreases with depth. The actual penetration depends on moisture content and the degree of fracturing; saturated clays attenuate high frequencies and reduce the effective range, so we adjust source energy and geophone spacing based on a walkaway test conducted at the start of each survey.

What does a seismic tomography survey cost for a typical Burlington residential lot?

For a standard residential or small commercial lot in Burlington, a combined refraction-reflection tomography survey typically falls between CA$3,730 and CA$7,110, depending on line length, number of shots, and whether we need permits for road allowance access. Sites with steep slopes along the escarpment or limited access for a weight-drop trailer may require additional crew time, which affects the final figure. We provide a fixed-price proposal after reviewing the site plan and any existing borehole logs.

How do you handle background noise from the QEW and rail lines during acquisition?

Urban noise in Burlington, particularly near the QEW, Highway 403, and the GO Transit corridor, is a real factor. We mitigate it by stacking shots—typically 5 to 10 impacts per shot point—and applying bandpass filters during processing to isolate the seismic wavelet from traffic rumble. For reflection work, we schedule shoots during off-peak hours when possible and use horizontal geophone arrays that discriminate against vertically propagating surface waves from vehicles.

Can seismic tomography detect karst features in the Lockport dolostone?

Yes, but with important caveats. Air-filled cavities produce a sharp velocity contrast that tomography can image as low-velocity anomalies, often below 500–800 m/s. Mud-filled or water-filled conduits are more subtle and may require reflection profiling to resolve the cavity geometry. In our experience across north Burlington and the Mount Nemo area, combining tomography with resistivity profiling significantly improves the confidence in karst detection, because electrical resistivity responds to the fluid content that velocity alone may not distinguish.

How long does it take to get the final tomographic sections and report?

Field acquisition for a single 115-metre line typically takes one day with a three-person crew. Processing and interpretation require an additional 5 to 7 business days, during which we run iterative inversions, calibrate against any available borehole data, and prepare the 2D velocity cross-sections with interpreted geological boundaries. Expedited reporting is available if your excavation schedule demands it, but standard turnaround allows for proper quality control of the tomographic models.

Location and service area

We serve projects across Burlington and its metropolitan area.

View larger map